Overview Building Sources and Sinks Human Activities Exposure and Dosimetry Model Options Results References Execute Model
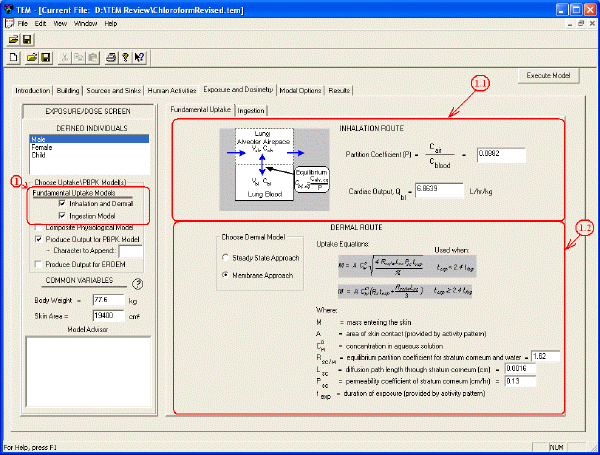
In the Exposure and Dosimetry screen, you define methods and parameters for predicting the absorbed dose and/or tissue-level concentrations for each of the occupants. The first step is to choose an occupant listed under Defined Individuals, enter his/her Body Weight and Skin Area (listed under Common Variables) and complete the screens as required. Repeat this process for each occupant.
There are two classes of models incorporated into TEM: uptake models and a composite physiological model. Under the heading Choose Uptake\PBPK Model(s), choose the Fundamental Uptake Model and/or the Composite Physiological Model. The Fundamental Uptake Model estimates the absorbed dose by each of the three routes of exposure: Dermal, Inhalation, and Ingestion. The Composite Physiological Model is a scaled-down pharmacokinetic model (PBPK) integrated with TEM. If you would prefer to implement a more robust or a different PBPK model, choose the option Produce Output for PBPK Model. There is also the option to Produce Output for ERDEM. Descriptions of the various models, model components, and output options are described below:

1. Fundamental Uptake Model: The Fundamental Uptake subscreen contains the uptake models for the Inhalation Route and the Dermal Route. These models estimate the amount of contaminant mass crossing the lungs and skin, respectively, and absorbed into the tissues and organs of the person’s body. The parameters needed for these models are entered on this screen.
1.1 Inhalation Route Uptake Model: For the Inhalation Route, TEM provides an equilibrium uptake model. The model assumes instantaneous equilibrium between the inhaled air in the lungs and the blood, assuming the blood has zero concentration prior to this absorption. It is assumed that the mass is absorbed into the blood, carried away to the liver to be metabolized, and returns to the lung free of the contaminant. In this sense, it is likely that the model slightly over-predicts the mass absorbed by the inhalation route under normal environmental conditions. For the Inhalation Route uptake model, enter the Partition Coefficient and the Cardiac Output.
1.2 Dermal Route Uptake Model: For the Dermal Route, choose between either the Steady State Approach or the Membrane Approach. Both approaches to dermal uptake are diffusion models. For the Steady State approach, enter the permeability coefficient. For the Membrane Approach, which assumes a build up and decay process, enter the equilibrium partition coefficient for stratum corneum and water; the diffusion path length through the stratum corneum; and the permeability coefficient of stratum corneum.
1.3 Ingestion Model: The Ingestion screen contains the uptake model for the Ingestion Route, estimating the amount of contaminant consumed and absorbed by the stomach into the tissues and organs of the person’s body. The ingestion of drinking water is typically represented as two components: (1) Direct Consumption, and (2) Indirect Consumption. Direct Consumption is defined as plain drinking water consumed directly as a beverage. Indirect Consumption is defined as tap water added to foods and beverages during final preparation at home or by service establishments such as school cafeterias and restaurants. An example of indirect water is water added to dry cake mix. This model requires you to provide the following parameters:
(i) Consumption Events: The consumption behavior of individuals is somewhat understood from a population and daily consumption perspective. However, the consumption behavior is less understood for individual consumption events. The understanding of these individual events may become important when examining internal dose and kinetics of contaminant removal in the human body. For this reason, this model has provided a means for distributing the consumption throughout the day. For both direct and indirect consumption, you enter a value for Average Number of Consumption Events (events/day), the Time of Day when Earliest Consumption may Occur (24 hour clock); and the Time of Day when Last Consumption may Occur (24 hour clock). The average number of consumption events is used as the frequency, and the events are distributed throughout the day between the user-entered start time and end time using a Poisson process.
(ii) Duration of Each Event: The duration of any individual consumption event (i.e., how long it takes an individual to consume the quantity of tapwater) is not well understood. Anecdotally, we have observed individuals who consume a full glass of water in a few seconds, as well as individuals who sip a single glass of water for an hour or two. Although this behavior has not been well quantified, it is very likely that these different duration behaviors can be well represented by a lognormal distribution from a population perspective. This model allows you to enter a geometric mean and geometric standard deviation for both direct and indirect consumption events, and uses the entered parameters to sample a lognormal distribution for the duration each time a consumption event is simulated according to the user-entered frequency information.
(iii) Consumption Volume. The model requires you to enter the geometric mean and geometric standard deviation for the occupant’s direct and indirect tap water consumption. For guidance in estimating these values, press the adjacent information button to view estimates of Direct and Indirect Consumption based on the database created from the 1994-96 USDA’s Continuing Survey of Food Intake by Individuals (CSFII) (See Tables 1 and 2 below). This survey was conducted over the three-year period between January 1994 and January 1997. More than 15,000 persons in the United States were interviewed on two non-consecutive days with questions about what drinks and foods they consumed in the previous 24 hours. The EPA report, "Estimated Per Capita Water Ingestion in the United States" (Jacobs, HL, et al., EPA/822/00/008, April 2000), presents an analysis of the direct and indirect ingestion data from the CSFII Survey.
Table 1. Estimated Direct Water Consumption in the United States
(Based on an analysis of the CSFII data)
|
Population Group |
Geometric Mean (mL/day) |
Geometric Standard Deviation |
|
Women, 20 yrs and older |
385 |
0.923 |
|
Men, 20 yrs and older |
390 |
0.988 |
|
Children, ages 1-10 yrs |
189 |
0.917 |
|
All ages |
322 |
1.025 |
Table 2. Estimated Indirect Water Consumption in the United States
(Based on an analysis of the CSFII data)
|
Population Group |
Geometric Mean (mL/day) |
Geometric Standard Deviation |
|
Women, 20 yrs and older |
385 |
0.789 |
|
Men, 20 yrs and older |
419 |
0.845 |
|
Children, ages 1-10 yrs |
97 |
0.919 |
|
All ages |
290 |
0.928 |
The total consumption volume is distributed among the individual consumption events by sampling a uniform distribution and distributing the volume according to the sampled numbers. The following equation is used to distribute the consumption volume:

Where:
Vi = the volume of water consumed during event i
N = total number of simulated consumption events
(U(0,1) = a randomly sampled number between 0 and 1
(iv) Volatilization: This model provides two alternative methods for representing the losses of contaminant due to volatilization. Choose either Constant Fraction or Calculated based on a Constant Component and an Exponential Decay as described below:
Ř Constant Fraction: Represents the losses as a constant amount, as represented by the Average Fraction of Contaminant Removed Prior to Consumption. Enter this value for both direct and indirect consumption.
Ř Calculated based on a Constant Component and an Exponential Decay: Represents the losses as a combination of two components (1) a constant amount (assumed to occur during filling), entered into the screen as Average Fraction of Contaminant Remaining Prior to Storage and (2) an Exponential Rate Constant (1/hr) (assumed to occur during storage).
Volatilization of a VOC from the tap water occurs at varying rates, depending upon several factors including the physical characteristics of the faucet and chemical properties of the VOC. In addition, the processes (e.g., heating, storage, mixing, etc.) that the water is subjected to influences the amount of the contaminant remaining in the water at the time it is consumed. A very limited number of studies have quantified the fractional volatilization due to these various factors. The following two citations have examined some of these factors:
§ Howard, C and Corsi, RL, "Volatilization of Chemicals from Drinking Water to Indoor Air: Role of the Kitchen Sink," J. Air and Waste Management Association, 46:830-837, Sept. 1996.
§ Batterman, S, Huang, A, Wang, S, and Zhang, L, "Reduction of Ingestion Exposure to Trihalomethanes Due to Volatilization," Environ. Sci. Technol., 34:4418-4424, 2000.
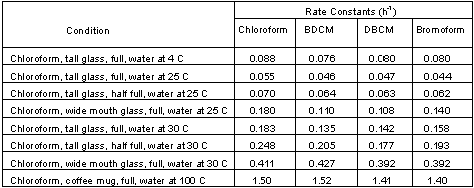
The simplest scenario involves two major actions: (1) filling a container, and (2) storing the water until it is consumed. For the first portion of this scenario, the VOC volatilized during filling can be approximated using the findings of Howard and Corsi, as reproduced in Table 3, below. For the second portion of this scenario, the volatilization during storage can be approximated using the findings of Batterman et al. Batterman et al. showed that the losses can be represented as an exponential decay process, as given by the following equation: C=Cexp(-kt). Batterman et al. examined the rate constants for the trihalomethanes. These findings are given in Table 4.
TABLE 3. Summary of Experimental Stripping Efficiencies for Toluene Measured by Howard and Corsi for Kitchen Sink Experiments; water temperature approximately 23 deg C.
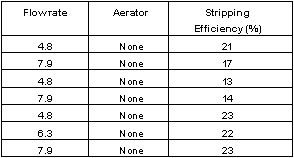
TABLE 4. Estimated Rate Constants for the Trihalomethanes from Batterman et al.
2. Composite Physiological Model: The Composite Physiological Model is a standard PBPK model integrated into TEM. Currently this feature is only partially implemented and is not ready for use. Information about each of the compartments and processes can be found on the screen by clicking on the labels and arrows.
3. Produce Output for PBPK Model: Choose this option if you want to utilize an external PBPK model (other than the integrated Composite Physiological Model). TEM will create "transfer files" that allow a PBPK model to read the results of the concentration and exposure calculations, such that the PBPK model can model internal concentrations and doses. For a description of the format of these output files, refer to the section below entitled Transfer File Definitions. These transfer files will be saved in files named according to the format described in Table 3, below, based on exposure route, occupant, and simulation number. If you choose to run 1000 simulations, there will be 1000 transfer files for each exposure route and occupant. If, for the same exposure route and occupant, you are modeling different chemicals or changing other variables between model runs, you may want to make the file names unique. In this case, you can choose to append the file name with an additional character. Otherwise, all model runs with the same exposure route and same occupant will have the same transfer file names (and in multiple runs, will be over-written). For example, if you want to run the inhalation model for the male occupant with chloroform, and then run it with BDCM, you will want to append the file names with a character to identify the chemical to you (i.e. A = chloroform, B=BDCM). You can enter the identifying character in the space on the screen labeled, Character to Append. Also, please note that these transfer files will not be deleted by TEM, so you will need to either archive or delete them when you are finished with the PBPK modeling run.
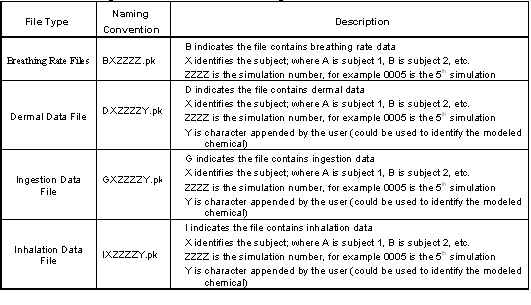
3.1 Transfer File Definitions: The exposure model (TEM) and the PBPK model communicate by passing parameters, media concentrations, physiological, and other necessary data in "transfer files." These transfer files are text files (ASCII) formatted such that the data are passed in fixed column format. Each model run, which encompasses the model predictions for a single household simulation, in this case a family of three, generates a group of files with related filenames. A description of the file naming convention is given in Table 5. Each of the files listed in Table 5 contains data in a fixed column format. For each of the file types listed in Table 5, a description of the file format is presented below:
TABLE 5. Description of Transfer File Naming Conventions.
(i) Breathing Rate Files: The breathing rate files contain a definition of the time-varying breathing rate of the subject. The file format is a comma separated ASCII file with the following characteristics:
§ Each line contains a record of the subject’s breathing rate for a time interval. The first number on each line is the time that the breathing rate interval started, in hours. The second number on each line is the breathing rate, in L/hour. These numbers are separated by commas.
§ A breathing rate defined by a given line is in effect until the start time of the subsequent line in the file.
§ Any line that contains a semi-colon (;) in the first column is ignored (indicates a comment).
Example: The data for a scenario where the breathing rate is modeled as 540 L/hour from midnight to 7:05 am, 600 L/hour from 7:05 am to 10:40 pm, and 540 L/hour from 10:40 pm to midnight. The resulting breathing rate data file contained the following data:

(ii) Dermal Data Files: The dermal data files contain a definition of the time-varying doses due to water contact with portions of the subject’s skin along with the time and duration of the event. The file format is a comma separated ASCII file with the following characteristics:
§ Each line contains a record of an exposure event. The first number is the time that the dermal exposure event started, in hours; the second number is the dose, in µg; and the third number is the duration of the event, in hours. These numbers are separated by commas.
§ Any line that contains a semi-colon (;) in the first column is ignored (indicates a comment).
Example: The data for a scenario where three dermal exposure events occur: (1) from 6:00 to 6:04:21 am, the dose is 0.0000125 µg corresponding to a handwashing activity; (2) from 6:09:00 to 6:16:30 am, the dose is 0.000085 µg, corresponding to a showering activity; and (3) 7:22:30 to 7:23:41 am, the dose is 0.00000164 µg, corresponding to a handwashing activity. The resulting breathing rate data file contained the following data:

(iii) Ingestion Data Files: The ingestion data files contain a definition of the ingestion doses due to water consumption. The file format is a comma separated ASCII file with the following characteristics:
§ Each line contains a record of a consumption event. The first number is the time that the event started, in hours; followed by an "I" or a "D" indicating either direct or indirect consumption; followed by the dose due to the consumption event, in µg; and then followed by the duration of the event, in hours. These numbers are separated by commas.
§ Any line that contains a semi-colon (;) in the first column is ignored (indicates a comment).
Example: The data for a scenario where three ingestion exposure events occur: (1) from 5:39:50 to 5:40:20 am, ingestion route is direct, and the dose is 0.00009663 µg; (2) from 6:47:50 to 6:50:10 am, ingestion route is indirect, and the dose is 0.000007059 µg; and (3) 7:41:50 to 7:43:23 am, ingestion route is indirect, and the dose is 0.0000585795 µg. The ingestion data file contained the following data:

(iv) Inhalation Data Files: The inhalation data files contain a definition of the time-varying inhalation concentrations. The file format is a comma separated ASCII file with the following characteristics:
§ Each line contains a time-varying record of inhalation concentrations. The first number is the time that the event started, in hours. The second number is the current inhaled concentration, in µg/m3. These numbers are separated by commas.
§ Any line that contains a semi-colon (;) in the first column is ignored (indicates a comment).
Example: The data for an example 24-hour period are presented as follows:
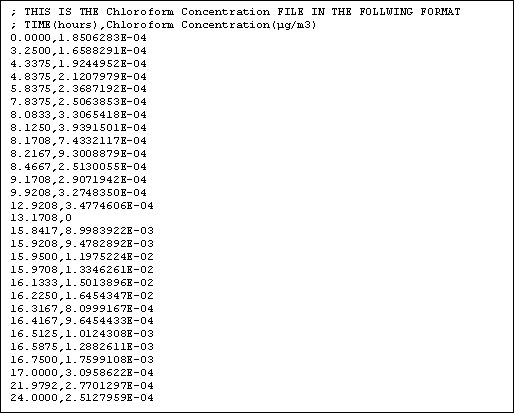
Note: The concentration reported at 13.1708 as 0 reflects the subject location of outdoors. The outdoor concentration is assumed to be zero.
4. Produce Output for ERDEM: The Exposure Related Dose Estimating Model (ERDEM) is a PBPK model used in conjunction with TEM in the EPA study described in:
Wilkes CR, Power FW, Blancato JN, Hern SC, Mason AD, Tsang AM, et al. Sept. 2002. "Developing Individual Human Exposure Estimates for Individual DBPs." Published as Appendix to "The Feasibility of performing cumulative risk assessments for mixtures of disinfection by-products in drinking water." Teuschler LK, Rice GE and Lipscomb JC. June 2003. USEPA National Center for Environmental Assessment. EPA/600/R-03/051.
On the Exposure and Dosimetery screen, you have the option of choosing the TEM output to be compatible with ERDEM. The transfer files to ERDEM are formatted in a manner similar to the PBPK transfer files described above.
For more information on ERDEM, refer to: http://www.epa.gov/heasdweb/erdem/erdem_report.pdf